
Updated 23 October 2026
On portfolio yield, how to calculate the combined income from your investments, and why this figure matters when planning your financial future.
What Is Dividend Yield? (And How It’s Calculated)
Dividend yield is the income a stock pays you, expressed as a percentage of its price. Take a share that costs a hundred pounds and pays you four pounds in dividends over a year. £4 on a £100 is a 4% yield.
The calculation is simple:
Annual dividend ÷ price × 100
For a single stock, you barely have to calculate anything, because every broker and finance site lists the yield next to the price.
Because yield is the dividend divided by the price, yield moves in the opposite direction to price. If a £100 share drops to £80 but still pays the same £4, the yield jumps to 5%. The company did not suddenly get more generous; the price just fell.
Why Calculating Portfolio Yield Is Harder Than It Looks
You probably do not own just one stock. You own a whole bunch of them in varying weights, maybe ten, twenty, or fifty different companies.
The mistake new investors make is to average the individual yields together. If you have a 3% stock and a 5% stock, the portfolio must be 4%, right? That is wrong because it ignores how much money you actually have in each one.
Your portfolio yield is a weighted average. The size of each position changes the overall result.
Portfolio Yield Example: Weighted Average Calculation
Consider two holdings:
- £10,000 in a stock yielding 3%
- £1,000 in a stock yielding 6%
A simple average would give you 4.5%. But the accurate calculation is:
- The larger holding produces £300 a year.
- The smaller holding produces £60 a year.
- Total income: £360 a year.
- Total invested: £11,000.
- Portfolio yield: about 3.3%.
Nowhere near that 4.5%. The bigger position pulls the whole portfolio towards its own yield, because that is where your money actually is.
The proper way to think about it is to add up all the real income your portfolio pays you across a year, in pounds, and divide it by the total value of the portfolio. That gives you your true, blended, or aggregate yield.
Why Portfolio Yield Calculations Get Complicated
In practice, calculating portfolio yield is more complicated for a few reasons:
- Your holdings are all different sizes, so you have to weight every single one.
- Many dividend stocks are American, Canadian, or European. Their dividends arrive in dollars or euros, so you need to convert everything back into your currency.
- Companies pay on different schedules: some quarterly, some monthly, some twice a year, and some just once.
- Prices move every day, while companies can raise or cut their dividends. This means a yield calculated today may already be slightly out of date by next week.
Current Yield vs Yield on Cost: What’s the Difference?
There are two versions of this number, and both can be useful to dividend investors.
Current yield is based on what your portfolio is worth today. It tells you the income rate you would get if you bought your portfolio at today’s prices.
Yield on cost is based on what you originally paid. It tells you how hard your invested money is working, and it is the figure long-term holders often focus on because dividend increases can make it rise even while the current yield still looks modest.
Yield on Cost Example: How It Grows Over Time
Years ago, you bought a company at £50 a share. At the time, it paid £2 a year, giving you a 4% yield.
Since then, it has raised its dividend every year and now pays £4. The share price has doubled to £100, so a new buyer today still sees a 4% yield. But you are receiving £4 on the £50 you paid.
Your yield on cost is 8%.
You held a good dividend grower and let time do the work. It is a big part of why patient investors stick with these companies for decades.
Why Tracking Your Portfolio Yield Matters
Your portfolio yield can become one of the most useful numbers in your financial plan.
It tells you, in a single figure, how hard your money is working for income. If you have £50,000 invested at a 4% yield, that is £2,000 a year you can plan around, reinvest now, or live on one day.
It also lets you check yourself against a target. Many investors have a yield they are aiming for or an income they need to cover certain bills. Without your blended yield, you are guessing whether you are on track.
You can run the calculation backwards, too. If you want £1,000 a month one day, or £12,000 a year, a 4% yield would require £300,000 invested. At a 5% or 6% yield, the target comes down.
Your yield is the dial that decides how large a portfolio you actually need.
That is also the idea behind the Minimum Viable Lifestyle calculator. You enter your essential monthly costs, such as rent, food, bills, and transport, choose a target yield, and it works out the portfolio size you would need to cover your basics from dividends alone.
Tracking your portfolio yield over time can also flag when something is wrong. If your blended yield is creeping up, ask why. Is it healthy income growth, or has something you own dropped sharply and might be about to cut its dividend? A high yield is not always good news.
If one of your holdings suddenly shows 9% or 10% when it used to sit around 4%, the market may have marked the price down because it is anticipating a dividend cut. If that cut happens, your income drops and the share price may have fallen with it. That is a yield trap.
Portfolio yield is also the foundation for forecasting. Once you know your yield and your capital, you can project your income forward, see whether it is growing year on year, and make informed decisions about where new money should go.
How to Calculate Portfolio Yield Yourself (Step-by-Step)
If you want to calculate your portfolio yield manually, the process is straightforward. The main task is to work through each holding, estimate the income it is expected to generate over a full year, and then combine those figures. This gives you a clearer picture than simply looking at the yield shown beside each individual stock.
Start by gathering the following information for every investment:
- List every holding and record the number of shares you own.
- Find each company’s annual dividend per share, using either its declared forward dividend rate or the payments made over the last twelve months.
- Multiply the annual dividend per share by the number of shares you own to estimate that holding’s yearly income.
- Convert dividends from foreign currencies into your own currency so the figures can be combined.
- Repeat the process for every holding in the portfolio.
After working through the list, add the estimated income from all your holdings together. This gives you your total expected annual dividend income. Then divide that figure by the current value of your portfolio to calculate your current portfolio yield.
Portfolio yield = Total expected annual dividend income ÷ Current portfolio value × 100
For yield on cost, use the same annual income figure but divide it by the total amount you originally invested instead of what the portfolio is worth today. This shows how much income your original investment is producing.
Keep your assumptions consistent. Decide whether you are using each company’s latest declared dividend or its payments over the past twelve months, and use the same approach across your holdings. Remember that the result is an estimate because dividends, exchange rates, and share prices can all change.
Why Spreadsheets Make Portfolio Yield Hard to Track
Many people try to do this in a spreadsheet, pulling in live prices with a formula. If you want live figures, it will probably cost you; Google Finance formulas do not include dividends.
You can enter everything manually, and it works for about a week. Then a price moves, a dividend is raised, you top up a holding, or a currency shifts, and your spreadsheet is out of date again.
It is not really a calculation you do once. It becomes a spreadsheet you maintain, more or less forever. That is where many people give up and stop tracking it, or accept a rough estimate.
The Easier Way to Track Portfolio Yield
Simply Wall St is a tool that does this work automatically and keeps it current.
You link your broker once, and it pulls in your holdings, calculates annual income across every position, handles currency conversions and different payment schedules, and gives you your blended portfolio yield, including current yield and yield on cost, updated as prices and payouts change.
If you prefer not to link your account directly, you can use your trade history. Investment platforms such as Trading 212 can provide this as a file that is simple to upload.
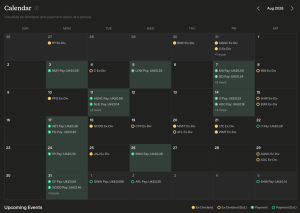
The calculations that would otherwise take time in a spreadsheet happen in the background. The tool also includes a payment calendar and income forecasts, but the yield calculation alone is one of the more difficult tasks to maintain by hand.
If you would rather spend less time maintaining spreadsheets, Simply Wall St can help you track your holdings, estimate dividend income, and monitor your portfolio yield in one place.
Conclusion: Why Portfolio Yield Matters for Your Income Plan
Knowing your overall portfolio yield gives you a practical way to connect your investments with the income you hope to receive. Instead of looking at each stock separately, you can see how much your entire portfolio is expected to generate and whether that amount supports your plans.
It also helps you set realistic targets. You can estimate how much capital may be needed to produce a certain annual income, track your progress, and investigate changes that deserve a closer look.
Keep the figure updated, however you calculate it, and know what it actually shows you. It won’t guarantee future income, but it gives you a real number to plan around, for saving, reinvesting, or working toward financial independence.
Portfolio Yield: FAQ
How Do I Calculate My Portfolio Yield?
Add up the annual dividend income from every holding in pounds, divide by the current portfolio value, and multiply by 100. Convert any foreign dividends into pounds first.
Can I Just Average the Yields of My Individual Stocks?
No. Portfolio yield is a weighted average, so position size matters. £10,000 at 3% and £1,000 at 6% looks like 4.5%, but the real yield is about 3.3%.
What Is the Difference Between Current Yield and Yield on Cost?
Current yield uses today’s portfolio value; yield on cost uses what was originally paid. A share bought at £50 that now pays £4 has a yield on cost of 8%, even if its current yield is 4%.
Is a High Portfolio Yield Always a Good Sign?
Not necessarily. Yield rises when prices fall, so a jump can mean a holding has dropped ahead of a dividend cut. A stock that usually yields 4% suddenly showing 9–10% is a classic yield trap warning.
Can I Track Portfolio Yield in a Spreadsheet?
Yes, but it needs constant upkeep. Google Finance doesn’t pull dividend data, so figures are usually entered by hand and go out of date as prices, dividends, and exchange rates change.
Is There a Tool That Calculates It Automatically?
Yes. Simply Wall St links to a broker or imports trade history and keeps current yield and yield on cost updated automatically as prices and payouts change.
This article is for information and education only and is not financial advice. It does not take account of individual circumstances. The value of investments can fall as well as rise and investors may get back less than they invest. Anyone unsure about their own situation should speak to a regulated financial adviser. This article contains affiliate links, which may earn The Dividend Experiment a commission at no extra cost to you.