
Updated 23 October 2026
On stock buybacks vs dividends, what companies do with their surplus cash, and what those choices mean for investors who rely on income.
What Companies Do With Surplus Cash
A company can pay you a rising dividend, say all the right things about shareholder returns, and still be spending most of its money somewhere you are not looking. The information is usually available in company announcements and financial reports; it simply is not always placed next to the dividend figure.
A company’s surplus cash generally has four possible destinations:
- Back into the business.
- Onto the debt.
- Out to shareholders as a dividend.
- Into buying back the company’s own shares.
Each pound or dollar can only take one of those routes. When a company spends heavily on buybacks, that money is not a bonus running alongside your dividend. It is money that did not become a dividend, pay down debt, or get reinvested in the business.
The useful question is not whether buybacks are automatically good or bad. It is what the money actually bought and what it cost.
Real Value, but Not Immediate Income
Apple is a straightforward example of how buybacks can create value without providing much cash income.
In its 2025 financial year, Apple spent just over $89 billion buying back its own stock and about $15 billion on dividends. For every dollar it paid in dividends, it spent nearly six dollars on buybacks.
In May 2025, Apple’s board authorised another $100 billion in repurchases and raised the quarterly dividend from 25 cents to 26 cents. The dividend increase was tiny compared with the scale of the repurchase programme.
Simply Wall St’s figures make this easy to spot. Apple’s dividend yield was about 0.4%, while its buyback yield was 1.9%. These were trailing-twelve-month figures, so they do not align exactly with the financial year in the filing, but they show the same broad pattern: several times more cash was going into Apple’s own stock than into shareholders’ accounts.
Simply Wall St also combines the two figures into total shareholder yield, around 2.3%. That number needs careful interpretation. A 2.3% dividend pays you 2.3% in cash whether the share price rises or falls. Apple’s 2.3% total shareholder yield consisted of approximately 0.4% cash income and 1.9% buybacks, with that value depending on the repurchases being made at sensible prices and only being realised by selling shares.
Apple’s buyback programme did achieve something useful: fewer shares existed, so each remaining shareholder owned a slightly larger proportion of the company.
But consider the alternative. Apple spent $89 billion on buybacks and $15 billion on dividends. If it had redirected even a quarter of the buyback spending to dividends, it could have roughly doubled the income paid to shareholders.
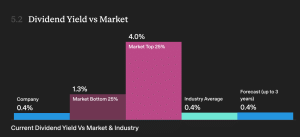
Apple could allocate more of that cash to dividends, but instead directs a much larger share towards repurchases. For an income investor, that distinction matters because buybacks don’t put cash into your account.
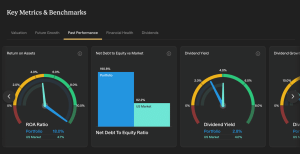
That may suit investors who do not need income. It also tells you what kind of holding Apple is. Apple is a dividend-growth stock, not a high-yield stock. Its dividend has been growing at around 6.6% a year, but that growth comes from a relatively small portion of its cash while the larger portion goes towards buybacks.
What Do Stock Buybacks Actually Do for Shareholders?
A buyback can have two very different purposes:
- Retiring shares, so fewer shares remain and each shareholder’s slice becomes larger.
- Buying back shares issued to employees as stock-based compensation, which prevents the share count from increasing.
The first can make shareholders better off. The second mainly prevents them from becoming worse off. Both activities may be described using the same language in company announcements, so you need to look more closely.
When Buybacks Do Not Benefit Shareholders
In its 2024 financial year, Salesforce was unusually direct about its repurchase activity. In its proxy statement, the company said its share repurchases fully offset its stock-based compensation for that year.
Stock-based compensation was roughly $3.5 billion annually, compared with earnings of $8 billion. The buybacks used real cash to cancel out the additional shares issued to employees, but did not achieve anything beyond maintaining the share count.
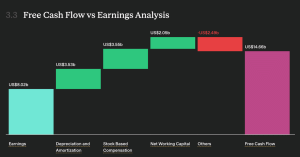
That money did not increase your slice of the company, accelerate dividend growth, widen the margin of safety beneath the dividend, or reduce debt. It simply stopped the share count from rising.
Paying employees partly in stock can be a normal way to compete for engineers, and offsetting that dilution can be a responsible decision. The important point is to recognise what the buyback accomplished.
A Much Bigger Buyback Commitment
Salesforce’s more recent figures show a very different scale. Its dividend yield was 0.9%, while its buyback yield was 23.3%. That means roughly 25 times as much was going into its own stock as was being paid to shareholders in income.
The total shareholder yield figure was around 24%, which sounds extraordinary until you realise that almost none of it was cash available to spend.
In March 2026, Salesforce launched a $25 billion accelerated buyback as part of a $50 billion authorisation, retiring more than a tenth of the company. Some of the programme is funded with borrowing, including notes that do not mature until 2066.
The buyback yield tells you how much the company is spending. It does not tell you what that spending achieved.
If management is correct that the shares are undervalued, the decision could work well. If it is wrong, Salesforce has taken on debt to overpay for its own stock. Either way, the spending does not arrive as dividend income.
What Happens When Stock Buybacks Stop
For almost two decades, IBM followed the opposite pattern. Reuters calculated that IBM spent more on buybacks over that period than it spent on capital investment and research and development combined.
By 2020, IBM had spent approximately $140 billion buying back its own stock over twenty years, while the entire company was valued at $105 billion. The amount spent buying shares exceeded the value of the company those purchases represented.
In July 2019, IBM acquired Red Hat and suspended its buyback programme. Its filings explained that the company needed to use the money to pay down the debt from the acquisition.
The change redirected cash elsewhere. IBM’s debt-to-equity ratio fell from around 250% to 176%, while revenue reached a record $67.5 billion, free cash flow reached a record level, and the dividend continued rising.
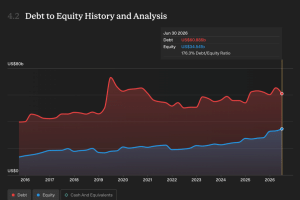
The share count increased somewhat because IBM was no longer buying back stock. Even so, shareholders saw better results after the buybacks stopped than during the preceding period.
IBM shows why buybacks should be assessed by what they achieve, not simply by the size of the announcement.
Three Real Outcomes Compared
These three companies used the same broad language, returning cash to shareholders, but the outcomes were very different.
– Apple bought a smaller share count. That created potential value for shareholders, but delivered it later rather than as immediate income.
– Salesforce initially used buybacks to offset stock-based compensation, then moved into a much larger, partly debt-funded repurchase programme.
– IBM spent heavily on buybacks for twenty years, then stopped and redirected money towards the business and debt reduction.
A dividend does one predictable thing: it pays cash to shareholders. A buyback might increase your ownership percentage, prevent dilution, be funded with borrowing, or represent money that could have served income-focused investors better elsewhere.
The announcement alone will not tell you which outcome applies. You need to check company by company.
How to Check Buyback Yield and Dividend Yield in Your Portfolio
Many dividend investors track their portfolios in a spreadsheet, recording holdings, payments received, and perhaps current yield. That is useful, but it mostly records the past.
A spreadsheet cannot easily show what is happening to a company’s dividend today: whether buybacks are taking several times more cash than dividends, whether the payout ratio is rising, or whether debt is building beneath the payment.
Those details are found in financial reports and company data, and they can change from one quarter to the next. Salesforce’s buyback yield, for example, moved from single digits to 23% within a year.
Simply Wall St’s portfolio tool brings these checks together in one place. You can add your holdings and view dividend yield, buyback yield, payout ratios, and debt information for each company without having to work through multiple filings and spreadsheets.
Try Simply Wall St to review your own holdings and see how companies are actually allocating their cash, dividend yield, buyback yield, and debt, all in one place.
Conclusion: Stock Buybacks vs Dividends
Buybacks and dividends are both ways for companies to allocate cash, but they are not interchangeable from an income investor’s perspective.
A dividend provides cash you can use. A buyback may increase your ownership share, offset dilution, or create value that only becomes available when you sell. It can also involve debt or represent money that might have been more useful as income.
That is why it is worth checking what each company’s buybacks are actually achieving, not just how much it announces it will spend.
Run the check on your own holdings. “Returning cash to shareholders” can mean very different things, and only one of those methods pays your bills directly.
This article is for information and education only and is not financial advice. It does not take account of individual circumstances. The value of investments can fall as well as rise and investors may get back less than they invest. Anyone unsure about their own situation should speak to a regulated financial adviser. This article contains affiliate links, which may earn The Dividend Experiment a commission at no extra cost to you.