
Updated 23 October 2026
Short answer: It depends on what you’re investing for.
- If your only goal is the largest possible pot of money over the long run, the S&P 500 has the stronger historical case on total return.
- If you want regular income that can eventually replace a salary and cover bills without selling anything, the (Almost) Daily Dividends pie is built for a job the S&P 500 isn’t designed to do.
And it doesn’t have to be either/or.
I want to be upfront: this isn’t a question with a clean universal answer, and if someone tells you it is, I’d be sceptical. There’s a reason personalised financial advice is regulated and requires a qualified professional: the right answer depends on your circumstances.
Anyone confidently telling you one investment suits everyone regardless of goals, timeline, risk tolerance and income needs is either oversimplifying to the point of uselessness or straying into territory they aren’t qualified for.
The S&P 500 and the pie are two different tools for two different jobs. The question isn’t “which is better?” It’s “better for what?”
Dividend Income or Total Return: What Are You Investing For?
To answer properly you need to be honest about what financial success looks like for you:
- A large pot of money at some point in the future?
- Replacing your salary with passive income?
- Covering your bills without touching capital?
- Retiring early?
These are different destinations, and they call for different routes.

How to Compare the Pie With the S&P 500 (Using VHYL)
A practical point first. The pie is a custom portfolio, which makes direct real-time performance comparison tricky. Trading 212’s AAR figure is a rough guideline but not a precise guide to past or future performance; what it does and doesn’t tell you is covered in what the AAR figure means.
A useful proxy for the pie’s style and performance is VHYL, the Vanguard FTSE All-World High Dividend Yield ETF. It isn’t identical, but it’s a well-known, easily trackable fund sharing the same broad philosophy: diversified, dividend-focused blue chips.
The pie is designed to outperform VHYL over time through more targeted stock selection, higher dividend frequency and active curation, so VHYL is a reasonable yardstick for how the income-focused approach is doing against the broader market. The VHYL review covers the fund itself.
If Total Return Is the Only Goal, the S&P 500 Has the Historical Edge
Measured purely on total return, capital growth plus dividends reinvested, the S&P 500 has historically outperformed a high-dividend-yield strategy over the long run. It’s heavily weighted to large growth companies, technology in particular, which have delivered exceptional capital appreciation over the past few decades.
An S&P 500 index fund bought 20 or 30 years ago with everything reinvested would show very impressive numbers.
So if your sole objective is the largest possible pot at some future point, with no interest in income along the way, the S&P 500 has a strong historical case and is worth considering instead of this pie.
Most people investing in it use Vanguard’s VUSA or VUAG; the two are compared in VUSA vs VUAG and the buying process in how to buy the S&P 500 in the UK.
S&P 500 vs VHYL Total Return: 2019 to 2026
Something concrete rather than generalities. Comparing the Vanguard S&P 500 ETF against VHYL, the proxy for the dividend income approach, from May 2019 to May 2026:
- S&P 500: roughly 168% total return
- VHYL: around 95% total return
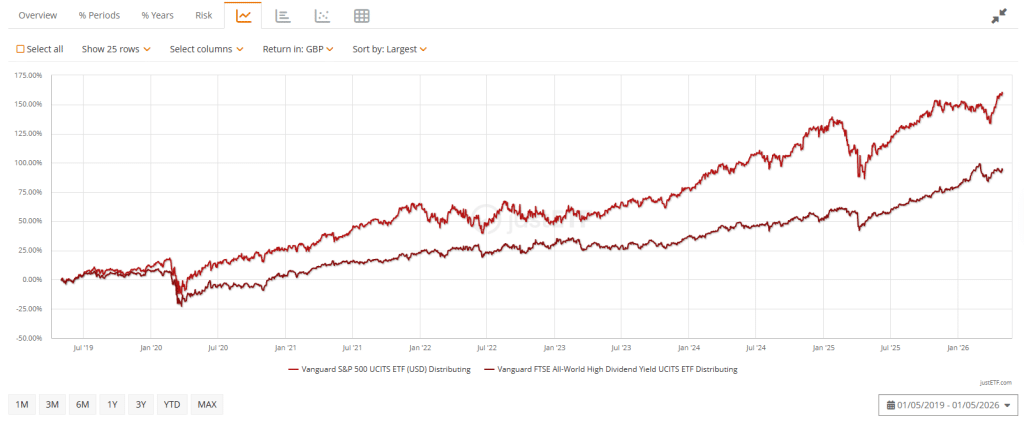
Three things are worth pulling out of that chart.
- The gap wasn’t always that wide. Through COVID, the recovery and into 2022 the two tracked fairly closely. The significant divergence came largely in 2023 and 2024, driven by an extraordinary run in mega-cap US technology on the back of the AI boom. A handful of companies, Nvidia, Microsoft, Apple, pulled the entire index upward in a way a globally diversified dividend fund was never going to replicate. Whether that concentration in a few tech stocks keeps delivering is a question nobody can answer with certainty.
- Look at 2022. When rising interest rates hit growth stocks hard, VHYL held up comparatively better. That’s the defensive quality of dividend-paying companies: more established, more profitable businesses that weather difficult environments more steadily. You don’t get the explosive upside of a tech-heavy index, but you carry a different risk profile.
- The S&P 500’s total return assumes you never touch the income. This is the most important point. The moment you start drawing on that portfolio to live on, the comparison changes completely, because you’re selling units to fund your lifestyle, eroding the base that generates the returns.
With a dividend portfolio the income is the product: you spend the dividends and the capital base stays intact. Those are fundamentally different ways of building a financial life, and a single total return chart doesn’t capture the distinction.
What If You Want Your Portfolio to Pay Your Bills?
This is where it gets more interesting, and more personal. Total return tells you almost nothing about how much income your portfolio puts in your pocket right now. A large capital gain doesn’t pay the mortgage. A growing number on a screen doesn’t cover the weekly shop. For that you need actual income, which is a different objective.
If your goal is £2,000 a month in passive income to cover essential living costs, you don’t get there by having a big number in an S&P 500 tracker and hoping the price keeps climbing. You get there by building a portfolio that reliably throws off cash, consistently, regardless of what the market is doing.
The pie is built specifically around that second goal: real, regular dividend income from a diversified set of blue-chip companies, with the “(almost) daily” part meaning your money is depositing income nearly every day rather than waiting for a quarterly or annual payout.
There’s a psychological dimension too. Watching a growth portfolio “do nothing” through a flat or falling market is uncomfortable even when you know you’re in it for the long term. Seeing dividends land regularly, even when the market is wobbling, is a completely different experience.
It reinforces that the portfolio is working, which makes it much easier to stay the course, and staying the course is one of the most valuable things an investor can do.
Holding Both: Dividend Income and an Index Fund
These two approaches aren’t mutually exclusive. You can build an income-generating dividend portfolio and hold a passive index fund for long-term growth. Structuring your investments so that different parts do different jobs is arguably more sophisticated than putting everything in one place and hoping it covers every need.
- The income layer handles day-to-day financial security.
- The growth layer builds wealth in the background.
They complement rather than compete, and the question becomes less about which to choose than how to structure both in a way that fits your situation.
How I Combine Income and Growth: The Metronome Portfolio
For context, and with the obvious caveat that it may not fit everyone: I follow a framework I call The Metronome Portfolio. The idea is that a portfolio should work like a metronome, a stable base that keeps the rhythm, with everything else built on top. The full explanation is in the Metronome Portfolio guide.
For the growth section I don’t actually use the S&P 500. I use a global index, for diversification at the country level. The S&P 500 is a good index, but it’s entirely US-focused, and concentrating your entire long-term growth allocation in one country, even the world’s largest economy, is a meaningful risk.
Recent years have shown how quickly sentiment around US markets can shift. A global index still gives you the US as the largest slice, but also the UK, Europe, Japan, emerging markets and beyond: broader, more resilient, less dependent on one economy performing indefinitely. That portfolio is The Boring Middle.
The Metronome approach isn’t about picking the best asset in isolation. It’s about building a structure where every part of the portfolio has a clear job, covering both present income needs and long-term growth.
(Almost) Daily Dividends Pie or S&P 500: Which Should You Choose?
- If you only care about total return over the long run, the historical data gives the S&P 500 a strong argument.
- If you want regular income that can eventually replace your salary and cover your bills, the pie is built for a job the S&P 500 isn’t designed to do.
- If you want both, you don’t have to choose; you need a structure that makes both work together.
More than any specific investment, the right answer starts with understanding what you’re building towards. What does financial success look like for you, in practice, in real life? Find a strategy that fits those goals, not the one with the most impressive headline return or the one everyone on social media is talking about. Your own.
The pie’s design, and the comparisons with VHYL and cash, are on the (Almost) Daily Dividends Portfolio page.