
The (Almost) Daily Dividends Portfolio
Hi. You have probably just come across The (Almost) Daily Dividends pie on Trading 212, or seen it mentioned somewhere, and want to know what it is before you put any money near it. That’s the right instinct, and this page is the full answer.
It covers what the pie is, how it was built, how to copy it, what your first couple of months will realistically look like, and what it’s doing with real money going in every week. By the end you should be able to decide whether it suits you, and if it does, set it up without guessing at anything.
If you already hold the pie and you’re here to look something up, the contents list below will get you there, and there’s a quick reference table and a troubleshooting section.
Nothing here is financial advice. It explains how the pie works and what the trade-offs are, so you can judge whether it fits your situation.

New to Trading 212?
Our promo code gets you a free fractional share. Just make sure you use it within your first 10 days.
Check out our Trading 212 Promo Code
*Capital at Risk. Sponsored content. Terms apply.
Quick Reference
| Holdings | 50 US-listed dividend payers |
| Payments a year | Around 248 |
| Weightings | Even across all 50 |
| Recommended start | £400, so no holding's dividend rounds to zero |
| Top-up that reaches every holding | Around £50, which is roughly £1 each |
| Reinvestment threshold | Trading 212's minimum order size ÷ your smallest slice weighting. Your exact figure is shown as "Min Investment" under Edit Pie |
| Rebalance signal | Pie score around 6.5 or below |
| Current yield | Live in the Dividend Dashboard |
| Current composition | The live pie link, with history in the changelog |
| Who manages your copy | You do. It's a template you copied, not a fund I run |
What Is the (Almost) Daily Dividends Pie?
It’s a portfolio of 50 US-listed dividend-paying companies, held on Trading 212 as a pie, built so that dividends arrive on close to every day of the year.
The frequency comes from the payment calendars of the companies themselves. Every company pays on its own fixed schedule: most US companies pay quarterly, and a smaller group pay monthly.
Hold one company and the income is lumpy, arriving four times a year with long gaps in between. The pie takes those calendars and deliberately arranges them around each other, so that one company’s quiet months are another’s payday.
If one company pays in January, April, July and October, another in February, May, August and November, and a third in March, June, September and December, between them they cover every month.
Scale that up across 50 holdings with staggered dates and the gaps close until income lands on most days. It works out at around 248 payments a year.
About 20 payment days this month
So the rhythm is a property of which companies are held and when they pay. It isn’t produced by the platform, and it isn’t affected by how often you deposit.
What’s Inside It
The composition is public. You can open the live pie and see every holding and every weighting before you commit anything.
Two payment cadences do all the work:
Quarterly payers make up the bulk of the pie. Each one contributes four payment dates a year, slotted into different months of the quarter so their cycles interlock rather than overlap.
Monthly payers are the smaller group, and they carry far more of the calendar than their number suggests. Each one contributes twelve dates a year rather than four, which is three holdings' worth of coverage from a single slot. They also even out what arrives. A quarterly holding pays its annual dividend in four larger instalments, while a monthly one spreads the same income across twelve smaller ones, so the monthly holdings keep a steady base of income running underneath the quarterly dates rather than leaving the flow to depend on them alone.

That second point matters more than it looks, because 50 holdings is the ceiling. A pie built only from quarterly payers would need roughly three times as many companies to cover the same number of days, which isn’t possible inside one pie and would mean diluting each position to the point where individual dividends round down to nothing.
Monthly payers are what make daily income achievable within the limit, so the pie leans on them deliberately rather than by accident.
Holdings are spread across sectors rather than concentrated in the obvious income corners of the market. Dividend investing has a natural pull towards utilities, REITs and consumer staples, and a portfolio that leans too far into any one of them stops being diversified and becomes a bet on interest rates.
- Financial Services24%
- Technology12%
- Basic Materials12%
- Consumer Defensive12%
- Industrials10%
- Real Estate10%
- Healthcare8%
- Energy6%
- Consumer Cyclical4%
- Utilities2%
The Thinking Behind It

The pie is built for income first and growth second, and the case for that is as much behavioural as financial.
Investing fails for most people long before the returns matter. They start, markets fall, nothing appears to be happening, and they stop. The single biggest determinant of where someone ends up is not which portfolio they chose but whether they kept going, and almost nothing in a conventional growth portfolio helps with that.
A number on a screen that moves up and down is abstract, and abstract things are easy to abandon.
Income arriving most days is not abstract.
You see the money land, you watch the reinvestment buy more shares, and the thing you’re doing feels connected to an outcome. That’s a small psychological difference that compounds into a large financial one, because an investor who stays in through a bad year doesn’t crystallise the fall, while one who sells does.
Plenty of people have told me the pie is what got them investing at all, and that the habit it built outlasted the pie itself. A good number later moved to something that suited their situation better, which I’d call a success rather than a defection.
The hardest part was starting and continuing, and if this is what makes that happen then it has done its job whether or not you hold it in ten years.
The trade-off is real and worth knowing. Prioritising reliable dividend payers means leaning towards established, slower-growing companies, which tend to hold up better when markets fall and tend to lag when markets run hot. In past bull markets a plain S&P 500 tracker has generally posted a higher total return.
That’s consistent with how I approach investing generally. The aim isn’t the maximum possible return from every pound, which turns investing into a second job and usually produces worse behaviour, not better.
It’s a return that’s good enough, from a portfolio you can live with and won’t abandon. More on that thinking is on the about page.
These pages go deeper on the trade-off itself:
Why the pie mixes dividend growth and high yield, deliberately.
How the pie compares with an S&P 500 index fund on total return.
The blunt one, which does get asked: is the pie a trap?
How the Pie Was Built

Selection started with whether a company could keep paying, and only then with when it paid.
Safety came first for a practical reason as much as a financial one. A holding that reliably keeps paying is a holding that never needs replacing. Every change to the pie creates work for everyone who copied it: a notification to read, a decision to make, a rebalance to approve, and the risk that someone misses it and drifts out of sync.
A pie built from companies with fragile dividends would need constant maintenance, and constant maintenance is the opposite of what this is for. So holdings were screened on payout ratios that leave room, a record of maintaining or raising the dividend, and a business generating enough cash to fund the payment rather than borrowing to cover it.
A high yield, by contrast, is the easiest thing in the world to find and usually the worst thing to chase.
An unusually high yield is frequently the market pricing in a cut that hasn’t been announced yet, and a cut dividend is a permanent hole in the income with a share price fall attached.
The calendar came second and only works if the first part held. Arranging 50 payment dates into daily income is a scheduling exercise, and a schedule is only as good as the payments actually arriving on it. One company suspending its dividend doesn’t just cost you that income; it punches a hole in a specific part of the month that the pie was relying on it to cover.
That’s why the safety screen runs first and the calendar fits around what survives it, rather than picking dates and hoping.
From the companies that passed, holdings were chosen to fill particular slots, mixing monthly and quarterly payers until the gaps closed.
The result is 50 holdings producing around 248 payments a year, every one of them public, so you can check the reasoning rather than take it on trust.
What the pie is not is a reaction to whatever is currently working. It doesn’t rotate into themes, chase momentum or adjust to the market’s mood, and that’s deliberate. The holdings were picked to be held for years, and a portfolio built around income you’re relying on is the last place you want to be making short-term calls.
What You Need Before You Copy
You can start a pie with far less, but this one needs around £400 to work the way it’s meant to, and the reason is about the dividends rather than the platform.
With 50 holdings, your money is split 50 ways. Put in £50 and each slice is around £1. A dividend on £1 of stock is a fraction of a penny, which rounds down to nothing, so you’d hold the company and receive no income from it at all.
That defeats the point of a pie built to pay you most days.
Starting at £400 puts roughly £8 into each slice, enough for every holding to produce a payment you actually receive rather than one that disappears in the rounding.
£50 start
~£1 a slice
£400 start
~£8 a slice
For top-ups after that, around £50 puts roughly £1 into each holding.
£400 isn’t a gate.
People commonly start lower and build past it with regular contributions. What you can put in, and when, is yours to judge. What I’d steer you away from is the version where someone puts in £100, never adds anything, and judges the strategy on the result.
Split 50 ways that’s £2 a holding, and £2 of anything pays small dividends. Nothing is wrong there, and the arithmetic would be the same whatever you held. Income scales with what’s invested, so the way to a meaningful number is to keep feeding it and let the compounding have something to work with.
Whether to put a lump sum in at once or build towards it is covered in lump sum or DCA into the pie?
Who Actually Manages Your Pie

You do, and this is the thing most worth understanding before you copy anything.
When you copy a pie you get a template: a list of holdings and weightings, applied once, to a pie that then belongs entirely to you. It sits in your account, holds shares you own, and nobody else can reach it.
I can’t see your pie, can’t trade in it, can’t rebalance it and can’t sell it. There’s no manager, no discretion and no one watching it on your behalf.
That cuts both ways. It means no management fee, no fund wrapper and no one taking a cut of your returns. It also means every decision after the copy is yours: whether to accept a change when the pie is updated, when to rebalance, whether to reinvest, and when to stop.
People occasionally assume that because I built the pie I’m somehow looking after their version of it. I’m not, and I’d rather be blunt about that now than have someone discover it at a bad moment. What I do is maintain the original template, log every change in the changelog, and explain the reasoning.
Beyond that I have no control over anything that happens in your app or your portfolio: not the settings, not the trades, not the timing, not what Trading 212 shows you. Those are between you and the platform.
What It Costs to Run
Less than most people expect, and the structure matters more than the exact rates because rates change and the structure doesn’t:
No commission on the trades inside a pie, however many holdings it contains.
No fee per deposit, so four deposits a month cost the same as one.
No annual management fee, because you own the shares directly and nobody is managing them. This is the structural difference from an income ETF, which charges a percentage of your holding every year whether it performs or not.
An FX fee on non-GBP holdings. The pie is US stocks, so this applies to most of what you do. It's charged on the amount converted rather than per transaction, so splitting a deposit into smaller ones doesn't increase it.
Current rates and the full list of fees are in Trading 212 fees explained, and the currency side specifically in how FX fees and currency risk affect your returns.
Fees are rarely the largest factor over time, though. Investor behaviour tends to matter more: stopping contributions in a downturn, selling during a fall, or repeatedly reworking a portfolio.
How to Copy the Pie Step by Step
Copying a pie takes a couple of minutes.
- Open the pie link. It loads the current composition: all 50 holdings and their weightings.
- Tap Copy pie. This creates your own pie, in your account, from the same template.
- Name it whatever you like, and set your initial investment.
- Choose your distribution method. Self-Balancing is the platform default, and the setup section below explains what each option does.
- Confirm. Your money is invested across the 50 holdings, and the pie is yours.
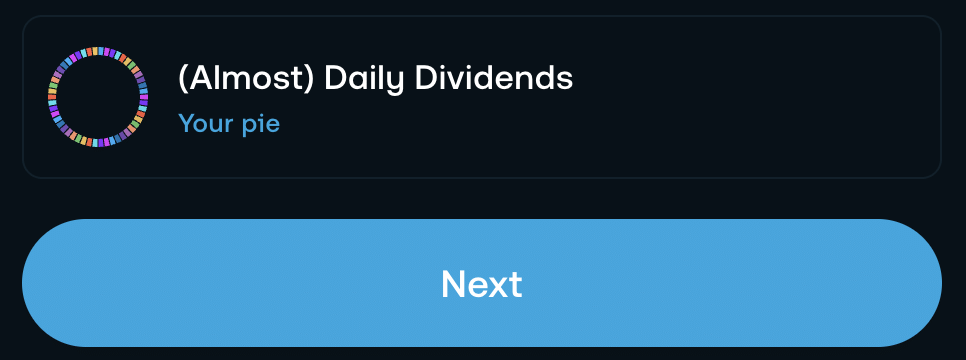
Your copy doesn’t change when the original changes. You stay linked for notifications, so you’re told when something has been updated and can choose to apply it, but nothing moves in your account without your approval. How to check that link is intact is in is your pie copy linked to the original?
You’ll need a Trading 212 account before any of this works. If you’re opening one, there’s a free fractional share available for new accounts within 10 days of signing up, and the details are on the promo code page. Capital at Risk. Sponsored content. Terms apply.
If you’ve never built a pie before and want the general mechanics rather than this specific one, there’s a walkthrough in how to create a pie on Trading 212.
What to Expect in Your First Two Months
Your dividends will not start immediately. To receive a company’s dividend you have to own the stock before its ex-dividend date, the cut-off that decides who gets the upcoming payment. Buy on or after it and that payment goes to whoever sold you the shares.

When you copy the pie today, you don’t qualify for the next dividend from all 50 holdings. You qualify for each one only when that company’s own ex-dividend date comes round. Some you’ll have missed by days, and you’ll catch the next one in a month or three. Others you’ll make with time to spare.
A rough guide to the build-up:
First two weeks Most people see their first dividend. Sometimes sooner.
End of month one Several payments from several holdings, but not yet one most days.
End of month two The full rhythm, with income landing on close to every day as the staggered calendar catches up with you.
The early payments will also be small. On a £400 start, a single dividend might be a few pence. They’re arriving, they’re just easy to miss unless you look at the individual transactions.
If you’re a month in and seeing nothing at all, that’s worth checking, and why haven’t my dividends arrived yet? walks through what to look at. For anything shorter than that, it’s the calendar rather than a fault.
How the Pie Is Tracked With Real Money
Since this page was first written I’ve been running the pie in public, so you can see what holding it actually looks like rather than relying on a description.
The (Almost) Daily Dividends Tracking Series follows a real account with £100 of my own money going in every week. Each episode covers what went in, what it bought, what the dividends looked like, and what the portfolio does as it grows. Nothing is cut when a month is dull or a holding reduces its dividend.
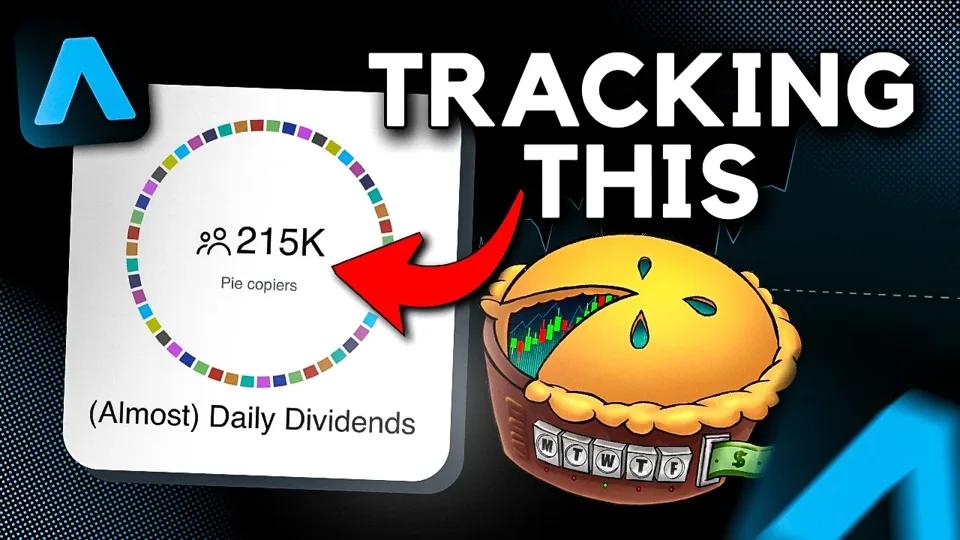
It’s the quickest way to check whether the income pattern described on this page matches what turns up in a real account.
The £100 weekly schedule keeps the series regular. It isn’t a recommendation. Monthly investing is what lines up with a monthly income, and the reasoning is in should you invest weekly or monthly?
The account shown is also a real one, so its figures reflect its own size and start date rather than something to scale up from.
What Changed and When
Every change ever made to the pie is logged in the (Almost) Daily Dividends changelog, with the date, the type of change, and which tickers went in and out. Three types are used:
Core A general composition change.
Minor A reactive change, usually a dividend cut or a corporate action.
Historical Significant enough that an old copy is worth replacing with a fresh one.
If your copy predates the September 2023 overhaul, copy the pie fresh rather than trying to patch it.
Changes are rare by design, which is the point of screening for dividend safety in the first place. A wobbling share price doesn’t trigger one; a dividend being cut or a company being acquired does. What counts and what doesn’t is in how often does the pie change?
Why Each Change Was Made
Trading 212 will tell you that the pie has changed. It won’t tell you why.
I send that part by email: what changed, what triggered it, what I considered and rejected, and whether you need to do anything. If you hold this pie, that context is the difference between a notification you ignore and a decision you can make.
How Much Will You Actually Get?
That depends on how much you invest, and you can work it out rather than guess.
The Dividend Dashboard is a free, view-only Google Sheet that pulls the pie’s live yield. Multiply your portfolio value by that yield for a rough annual income, and divide by twelve for a monthly figure.
Use it rather than any figure written here, because the yield moves with prices. A number typed into a web page is out of date the week after it’s published.
There’s also a compound interest calculator pre-filled with the pie’s figures, for the longer question of what reinvesting does over ten or twenty years. Reinvestment is where most of the long-run compounding comes from, and can you build a dividend pie and never add more money? works through it with and without fresh contributions.
Trading 212 also shows an AAR for the pie. It isn’t the dividend yield: it’s a five-year average total return, combining price movement and income, so don’t read it as the income you’ll receive. What the AAR figure means.
Setting It Up Properly
Four settings decide how your pie behaves day to day. None is permanent, and all can be changed later.
Dividend reinvestment On by default. Dividends collect in Pie Cash and are reinvested once they pass a threshold, shown as "Min Investment" under Edit Pie. On a small pie that takes a while, which is normal. How reinvestment works.
AutoInvest or manual deposits Both invest the same way. AutoInvest suits steady income and anyone prone to overthinking it. Manual suits irregular income. Plenty of people use both. AutoInvest or manual compared.
How each deposit is distributed Self-Balancing sends new money to underweight slices, which rebalances for you while deposits are large next to the pie. By Targets splits strictly by your target weightings. Self-Balancing vs By Targets.
How often you invest Matters less than it feels. Line it up with payday so cash doesn't sit idle. Weekly or monthly investing.
Keeping It Healthy Over Time
Stocks grow at different rates, so your actual weightings drift away from their targets. Rebalancing brings them back. Trading 212’s pie score measures how far they’ve drifted, and falls as the gap widens.
It isn’t a measure of performance.
Early on you probably don’t need to do anything, because Self-Balancing deposits handle it. Once the pie is large enough that deposits can’t move the allocations, watch the pie score: around 6.5 or below is usually where the drift is worth doing something about, which tends to work out at roughly once a year.
Trading 212 gives you two ways to rebalance. A top-up rebalance buys more of the underweight slices without selling anything. A buy-and-sell rebalance also trims the overweight ones, which outside an ISA can crystallise a capital gain. A few pence of Pie Cash left over afterwards is normal rounding. Do I need to rebalance the pie?
How It Compares

Against the S&P 500
Over most five-year stretches the S&P 500 has produced the higher total return, which follows from what each is built to do. What the pie has tended to do is fall less when the market falls.
Volatility is how far a portfolio's value swings. Smaller falls need smaller gains to recover from, and they're easier to sit through. A portfolio that moves less is one you're more likely to still be holding when the recovery arrives, and it carries on paying you throughout.
Falls 40%
needs +67%
Falls 20%
needs +25%
So the comparison isn't one number against another. It's whether you want the highest likely total return, or an income that keeps turning up through a portfolio you'll actually keep: the pie or the S&P 500?
Against VHYL
Vanguard's global high-dividend ETF is the closest off-the-shelf comparison, and more diversified geographically than the pie. It charges an annual management fee, pays quarterly, and you never have to think about it. The pie has no fund fee, pays far more often, and is concentrated in US companies. Every time I've tracked the two against each other, the pie has come out ahead. An ETF is less work; the pie gives you control, frequency and, so far, the better numbers.
Against cash
Trading 212's interest rate on uninvested cash sometimes looks competitive against the pie's yield, but it's the wrong comparison. Cash can't grow and its rate can be cut tomorrow; the pie carries real capital risk alongside its income. When holding cash does make sense: is cash interest better than the pie's yield?
On timing your entry
Waiting for a dip is a common reason people never start. There's no agreed definition of a dip and no reliable way to spot one coming, and with an income portfolio, time out of the market is time without dividends. The case either way is in should you wait for a market dip?
Common Mistakes

- Customising the pie and then expecting the same behaviour. Editing it is fine and I’d encourage it if you have a view. It’s your account and your money, and the whole point of publishing every holding is that you can look at each one and disagree. It does change two things. The staggered calendar is what produces daily income, so changing the composition changes the calendar. Once you’ve added holdings I didn’t pick, the allocation is yours rather than mine, which means I can’t answer questions about how those holdings are behaving or what to do with them. I don’t know what you bought or why.
- Reading the AAR as the yield. They measure different things. AAR is total return over five years; the yield is income. Expecting the AAR as income leads to disappointment that isn’t the pie’s fault.
- Pausing AutoInvest during a downturn. A fixed schedule keeps buying when prices are lower, which is the mechanism it was set up for. Pausing removes that, and it tends to come from the same impulse as selling rather than from a change of plan. Whether it matters to you depends on your circumstances and how long you’re investing for.
- Starting with £100 and leaving it there. Split 50 ways that’s £2 a holding, and £2 positions pay small dividends in any portfolio. Starting small is fine. Staying small is what limits it, because a portfolio you never add to has nothing to compound.
- Forcing a weekly schedule onto monthly pay. If your salary arrives on the 28th and you invest a quarter of it each week, three quarters of that money sits in cash for up to three weeks before it buys anything. Cash isn’t compounding, isn’t earning dividends and isn’t buying shares, so you’ve taken money that could have been working and parked it for no return. The schedule feels more active, but it’s doing less.
If Something Looks Wrong
Most “something’s broken” moments turn out to be the pie working normally. Here are the usual ones.

No dividends yet
Almost always the ex-dividend cycle not having come round. Normal in the first few weeks: full explanation.
Dividends arrived but haven't been reinvested
You haven't hit the reinvestment threshold yet. Check "Min Investment" under Edit Pie: how the threshold works.
Pie Cash sitting there after a rebalance
Rounding, not an error. Your next deposit sweeps it in: why this happens.
Pie score has dropped
Normal drift from price movement. Around 6.5 is the point to act: rebalancing.
You're not getting change notifications
Your copy may have become unlinked, which happens when you edit it: how to check.
A holding has disappeared or a new one appeared
Check the changelog for what changed and when.
Dividends smaller than expected
Usually portfolio size. Check your actual figure against the live yield in the Dividend Dashboard for a realistic number.
The AAR doesn't match the yield
It isn't meant to: what AAR measures.
If You Want Out
You can sell all or part of the pie whenever you like. Trading 212 sells the underlying holdings and the proceeds land as cash in your account, with US holdings trading during US market hours.
Outside an ISA, selling can trigger a capital gains event. Inside one, it doesn’t. The mechanics and a pre-sale checklist are in how to sell a Trading 212 pie.
Partial selling is worth knowing about, because people reach for the full exit when they only need some of the money.
Learning to Build Your Own
Everything above is about one pie. If what you want is to understand dividend investing well enough to make these decisions yourself, rather than following someone else’s portfolio, that’s a different and bigger thing.
The Dividend Academy is what I built for exactly that: how dividends work, how to assess whether a payout is safe, how to value an income stock, and how to construct a portfolio around your own goals rather than copying mine. It’s lifetime access, and enrolment includes premium access to The Dividend Temple Discord, where the discussion goes considerably deeper than anything that fits in a YouTube comment section.
You don’t need it to use this pie. The pie, the guides on this site, the dashboard and the tracking series are free and always will be. The Academy is for the point where you’d rather build your own.
A Closing Note

I make nothing when you copy this pie.
There’s no fee, no revenue share, and no arrangement where the number of copiers affects me. Ten people could copy it or a million, and my position is identical either way.
It’s also the reason I can be straight with you about it. I have nothing riding on you choosing this pie over anything else, so there’s no reason for me to talk you into it. If it fits what you’re trying to do, use it. If something else fits better, use that instead. If you take the idea and build your own version, better still.
What I’d ask is that you go in understanding it. The income builds over the first two months rather than starting on day one. It will probably lag in a rising market. Dividends can be cut and prices can fall. Your copy is yours and nobody is managing it for you. Every holding, every change and every reason is public, so you can check the working rather than trust the person.
The experiment this site is named after isn’t this pie.
It’s the longer question of whether an ordinary person, investing sensibly over years rather than aggressively over months, can build income that turns up whether they work that month or not.
The pie is one way of going at it, and a useful one for getting started, but it’s a tool in service of that question rather than the answer to it. The about page explains what I mean properly.
Next steps
Where to Go From Here
Pies & AutoInvest is an execution-only service, following your own investment decisions. Not investment advice or portfolio management. You are responsible for all investment and rebalancing decisions.
The content on this page is intended for information and educational purposes only and should not be considered investment advice or investment recommendations. When investing, your capital is at risk, and you may get back less than invested. Past performance does not guarantee future results. The selection of holdings in this pie reflects my own subjective judgement.